Process Flows, Wireframes, Diagrams & BPMN 2.0
A practical BA revision guide for understanding how to use diagrams to clarify business processes, system behavior, user interactions, data movement, status transitions, API flows, and system integrations.
Diagrams help Business Analysts convert complex requirements into clear visual models that stakeholders, developers, QA, and product teams can validate before development starts.
Why BAs Use Diagrams
Business Analysts use diagrams because many stakeholders understand visuals faster than long requirement documents. Diagrams convert complex business processes into simple, structured, easy-to-review artifacts.
Diagrams make process and system behavior easier to understand.
Business, development, QA, and product teams can validate the same flow.
Missing steps, exceptions, and handoffs become visible.
Manual steps, duplicate work, and bottlenecks are easier to identify.
Developers understand expected workflow and system behavior.
QA can create better test scenarios from visual flows.
Business users can validate real-world process flows.
System boundary, responsibilities, and in-scope items become clearer.
I use diagrams to simplify complex business processes and system behavior. Process flows, swimlane diagrams, BPMN diagrams, wireframes, use case diagrams, context diagrams, data flow diagrams, state diagrams, sequence diagrams, activity diagrams, and ERDs help stakeholders validate requirements, identify gaps, clarify handoffs, and support development and testing.
Process Flow / Workflow Diagram
A process flow shows the step-by-step sequence of a business process or system workflow. It answers: What happens first, next, and last?
- Step-by-step business workflow
- System workflow
- Approval process
- Current process
- Future process
- Decision points
- Alternate paths
- Exception paths
- Circle: Start / End
- Rounded rectangle: Task / Action
- Diamond: Decision
- Solid arrow: Sequence flow
Request Approval Process
A user creates and submits a request. The system validates required fields. If invalid, the user corrects them. If valid, a supervisor reviews and approves or rejects it.
Simplified BA learning diagram for interview revision.
- Start shows where the process begins.
- Rectangles show user or system actions.
- Diamonds show decisions.
- Yes/No paths show alternate outcomes.
- End shows process completion.
A process flow is a visual representation of the step-by-step sequence of a business or system process. I use it to show activities, decisions, alternate paths, exception flows, and end states. It helps stakeholders validate the process and helps developers and QA understand the expected workflow.
As-Is and To-Be Process Flow
An As-Is process shows the current workflow. A To-Be process shows the future, improved workflow.
| As-Is | To-Be |
|---|---|
| Current process | Future process |
| Shows manual steps | Shows automation or improvement |
| Shows delays and inefficiencies | Shows optimized workflow |
| Used during discovery | Used during solution design |
| Helps identify gaps | Helps define requirements |
As-Is — Manual Request Process
Today the process is paper-based and managed via email and spreadsheets.
Simplified BA learning diagram for interview revision.
To-Be — Automated Request Process
The future state automates intake, validation, routing, status, and notifications.
Simplified BA learning diagram for interview revision.
| As-Is Pain Point | To-Be Requirement |
|---|---|
| Paper form | System shall provide an online request form. |
| Manual email | System shall route requests automatically. |
| Missing information | System shall validate required fields. |
| Spreadsheet tracking | System shall maintain request status. |
| Manual status update | System shall send notifications. |
As-Is process flow documents the current workflow, including manual steps, delays, pain points, and inefficiencies. To-Be process flow shows the future improved process after automation or system implementation. The gap between As-Is and To-Be helps identify business requirements and process improvement opportunities.
Swimlane Diagram
A swimlane diagram is a process flow divided by role, team, department, or system. It answers: Who does what?
- Multiple roles are involved.
- Multiple teams or departments are involved.
- Handoffs are important.
- You need to show ownership.
- You need to separate user actions from system actions.
- You need to identify bottlenecks or duplicate work.
Request Approval Swimlane
Three lanes — Business User, System, and Supervisor — showing how a request flows across roles with handoffs between lanes.
Simplified BA learning diagram for interview revision.
- Each lane represents a responsible role or system.
- Actions inside a lane belong to that role/system.
- Arrows crossing lanes represent handoffs.
- Decisions show alternate paths.
A swimlane diagram is a process flow divided by role, team, department, or system. I use it when multiple parties are involved because it clearly shows who performs each step, where handoffs occur, and where ownership gaps or delays may exist.
BPMN 2.0
Business Process Model and Notation — a standardized visual language for modeling business processes.
BPMN 2.0 is a standard way to draw business process diagrams so business users, BAs, developers, vendors, and process teams understand the same workflow consistently. A normal flowchart can be informal — BPMN provides standardized symbols and rules for events, activities, gateways, sequence flows, message flows, pools, lanes, data objects, exceptions, parallel work, and start/end points.
BPMN Core Elements
Things that happen in a process.
Start: Request submitted • Intermediate: Payment confirmation • End: Request completed.
Work steps performed by users or systems.
Branching and merging logic.
XOR: only one path • AND: all paths • OR: one or more • Event: based on event.
Sequence vs message flow, with pools and lanes.
Gateway Rules
| Situation | Gateway |
|---|---|
| Only one path can happen | Exclusive Gateway (XOR) |
| All paths happen together | Parallel Gateway (AND) |
| One or more paths may happen | Inclusive Gateway (OR) |
| Path depends on an event | Event-Based Gateway |
Artifacts
Request form
Customer database
Approval required above $500
Payment-related activities
BPMN Full Example — Purchase Order Approval
Purchase Order Approval Process
A customer submits a purchase order. Sales receives it, Finance checks credit, Warehouse checks stock, Shipping dispatches, and Billing sends the invoice.
Simplified BA learning diagram for interview revision.
This is a BPMN-style learning diagram. For exact executable BPMN 2.0 modeling, use tools such as Camunda Modeler, Bizagi Modeler, Lucidchart, Signavio, or bpmn.io.
How to Build a BPMN Diagram
| Step | Action | Example |
|---|---|---|
| 1 | Define process name | Purchase Order Approval Process |
| 2 | Identify participants | Customer, Company |
| 3 | Identify roles | Sales, Finance, Warehouse, Shipping, Billing |
| 4 | Identify start event | Customer submits purchase order |
| 5 | Identify tasks | Review order, check credit, check stock |
| 6 | Identify gateways | Credit approved? Stock available? |
| 7 | Identify message flows | Customer sends order, company sends invoice |
| 8 | Identify end events | Order completed, rejected, pending |
| 9 | Add data objects | Purchase order, invoice |
| 10 | Validate with stakeholders | Confirm real process and exceptions |
BPMN Rules to Remember
BPMN vs Flowchart vs Swimlane
| Item | Flowchart | Swimlane | BPMN 2.0 |
|---|---|---|---|
| Main purpose | Show process steps | Show process steps by role | Standard business process modeling |
| Best for | Simple process | Multi-role process | Formal or complex process |
| Symbols | Flexible | Flexible + lanes | Standardized BPMN symbols |
| Shows ownership | Not always | Yes | Yes, using pools/lanes |
| Shows messages between participants | Not clearly | Sometimes | Yes, with message flow |
| Shows exceptions | Basic | Basic | Strong |
| BA usage | Quick explanation | Responsibility clarity | Formal process documentation |
BPMN 2.0 stands for Business Process Model and Notation. It is a standardized notation used to model business processes with elements such as events, activities, gateways, sequence flows, message flows, pools, lanes, and artifacts. I use BPMN when the process is complex, involves multiple roles, includes approvals or exceptions, or needs formal documentation.
Wireframe
A low-fidelity visual layout of a screen. It answers: What should the screen contain and how should the user interact with it?
Create Request Screen Wireframe
Low-fidelity layout used to validate fields, sections, controls, and actions before design.
Simplified BA learning diagram for interview revision.
| UI Area | Requirement |
|---|---|
| Required fields | Request Type, Request Date, First Name, Last Name, Email, Description |
| Optional fields | Priority, Phone, Attachments |
| Controls | Dropdown, date picker, textbox, text area, upload |
| Actions | Save Draft, Submit, Cancel |
| Validation | Required field validation |
| Layout | Requestor Details and Request Details sections |
A wireframe is a low-fidelity screen layout used to validate fields, sections, buttons, navigation, and user actions before development. I use wireframes to help stakeholders visually confirm what should appear on the screen and how users should interact with it.
Mockup
A more detailed visual design of a screen. It answers: How should the screen look?
Request Management Dashboard Mockup
Higher-fidelity dashboard with KPI cards, filters, and a data table.
Request Management Dashboard
Simplified BA learning diagram for interview revision.
| Wireframe | Mockup |
|---|---|
| Basic layout | More visual detail |
| Focus on structure | Focus on look and feel |
| Low fidelity | Medium/high fidelity |
| Used early | Used closer to design validation |
A mockup is a more detailed visual representation of the screen compared to a wireframe. It shows layout, spacing, visual hierarchy, and sometimes colors or branding. I use mockups when stakeholders need a more realistic view of the proposed UI.
Prototype
An interactive model of the screen flow. It answers: What happens when the user clicks?
Request Submission Prototype Flow
Clickable flow from dashboard through form, validation, confirmation, and final details page.
Simplified BA learning diagram for interview revision.
A prototype is an interactive version of the screen flow. It helps stakeholders validate navigation, user actions, and end-to-end user experience before development.
Use Case Diagram
Shows actors and what functions they can perform in the system. It answers: Who uses the system and what can they do?
Request Management System Use Case Diagram
Actors interact with system functions inside the system boundary.
Simplified BA learning diagram for interview revision.
| Actor | Use Cases |
|---|---|
| Business User | Login, create request, submit request, view request status |
| Supervisor | Login, review request, approve request, reject request |
| Admin | Login, manage users, configure workflow |
| Email Service | Sends notification |
A use case diagram shows actors and the system functions they can perform. I use it to define high-level system scope, user roles, and major capabilities. It does not show process sequence; it shows who interacts with the system and what actions are available.
Context Diagram
Shows the main system and its external users, systems, or services. It answers: What is inside the system boundary and what is outside?
Online Application Portal Context Diagram
The portal sits in the center with external users and systems around it.
Simplified BA learning diagram for interview revision.
| Element | Meaning |
|---|---|
| Online Application Portal | Main system |
| Applicant / Admin | External users |
| Payment System | External integration |
| Email Service | Notification integration |
| Document Management | File storage integration |
| Reporting System | Reporting integration |
A context diagram shows the system boundary and external interactions. I use it early in the project to clarify scope, external users, external systems, and integration points.
Data Flow Diagram (DFD)
Shows how data moves through a system: source, processing, storage, and destination.
Application Submission and Reporting DFD
Applicant submits data, system validates and stores it, manager pulls reports.
Simplified BA learning diagram for interview revision.
| Component | Example |
|---|---|
| External entity | Applicant, Manager |
| Process | Validate Application, Generate Dashboard |
| Data store | Application Database |
| Data flow | Application details, reports, validation errors |
A data flow diagram shows how data moves between external entities, processes, data stores, and systems. I use DFDs when requirements involve reporting, integration, migration, or data validation.
State Diagram / State Transition
Shows how a record moves from one status to another. It answers: What statuses can this item have, and what action changes the status?
Request Lifecycle State Diagram
Request moves through Draft → Submitted → Under Review → Approved/Rejected → Closed/Reopened.
Simplified BA learning diagram for interview revision.
| Status | Meaning |
|---|---|
| Draft | Request is created but not submitted |
| Submitted | User submitted request |
| Under Review | Supervisor is reviewing |
| Approved | Request approved |
| Rejected | Request rejected |
| Closed | Process completed |
| Reopened | Closed request reopened |
A state diagram shows the lifecycle of a record through different statuses. I use it when requirements involve approvals, closures, reopenings, or status-based rules. It helps clarify valid and invalid transitions.
Activity Diagram
Shows workflow activities, decisions, branches, merges, and end states.
Validate and Submit Request Activity Diagram
Models field validation, business rule validation, and the resulting save and confirmation behavior.
Simplified BA learning diagram for interview revision.
An activity diagram shows workflow activities, decisions, branches, and end states. I use it when I need to model business logic, validation flow, alternate paths, or process control.
Sequence Diagram
Shows interactions between users, applications, APIs, databases, and external systems over time. It answers: Who communicates with whom, in what order?
Submit Request Through API Sequence Diagram
A request travels from the user through the web app to the API, database, and email service, including validation pass and fail branches.
Simplified BA learning diagram for interview revision.
| Lifeline | Meaning |
|---|---|
| Business User | User submitting the request |
| Web Application | Front-end application |
| Request API | Backend service |
| Request Database | Stores request record |
| Email Service | Sends notification |
A sequence diagram shows the order of interactions between users, applications, APIs, databases, and external systems over time. I use or review sequence diagrams when integrations are involved because they clarify request-response behavior, validations, dependencies, and failure scenarios.
Entity Relationship Diagram (ERD)
Shows data entities and their relationships. It answers: What business objects exist and how are they related?
Customer Order System ERD
Customer → Order → Order Item, with Product connected to Order Item.
Simplified BA learning diagram for interview revision.
| Relationship | Meaning |
|---|---|
| Customer → Order | One customer can place many orders |
| Order → Order Item | One order can contain many items |
| Product → Order Item | One product can appear in many order items |
An ERD shows data entities, attributes, and relationships. As a BA, I use or review ERDs to understand business objects, data dependencies, reporting requirements, and source-to-target mapping.
System Architecture / Integration Diagram
Shows the major systems and how they connect. It answers: Which systems are involved and how are they connected?
Application Platform Ecosystem
User → Web Application → API Layer → Database and external services such as payment, email, document storage, and reporting.
Simplified BA learning diagram for interview revision.
| Item | Meaning |
|---|---|
| Web Application | User-facing application |
| API Layer | Handles system logic and integrations |
| Database | Stores application data |
| Payment Gateway | External payment integration |
| Email Service | Notification integration |
| Document Storage | File storage |
| Reporting Dashboard | Reporting output |
A high-level system or integration diagram shows the major systems, services, databases, and external integrations involved in a solution. I use it to understand system boundaries, dependencies, and integration points.
Real-World Diagram Examples
Two reference posters that combine multiple diagram types on a single canvas — useful for visualising how use case, activity, swimlane, sequence, and BPMN diagrams work together on real products.
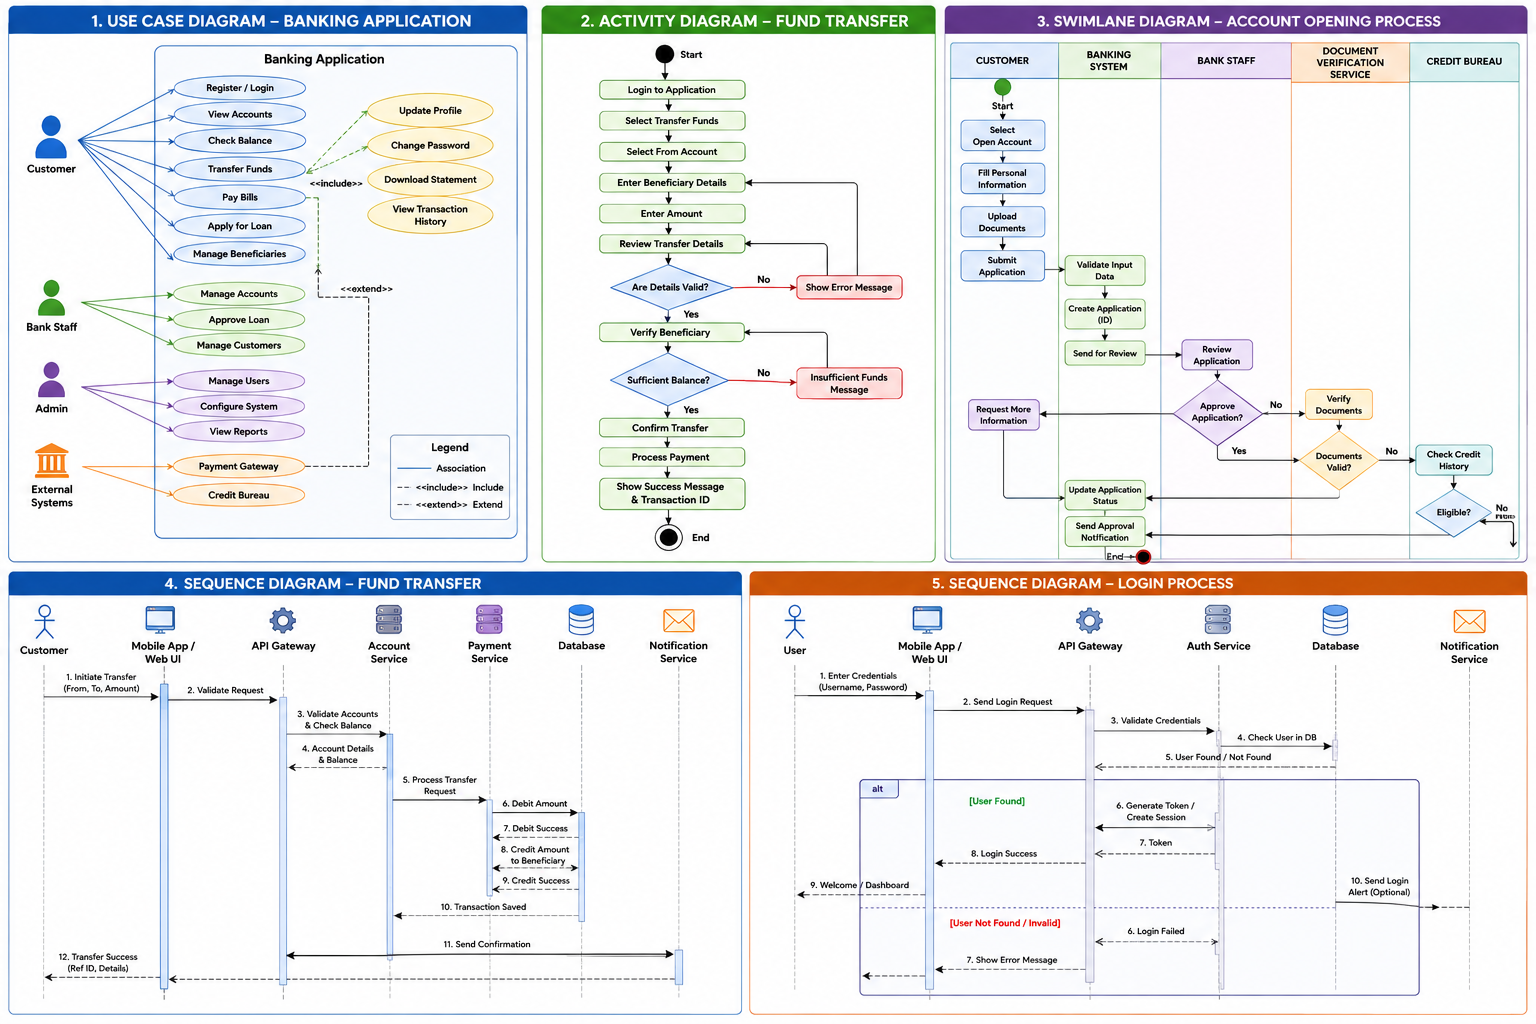
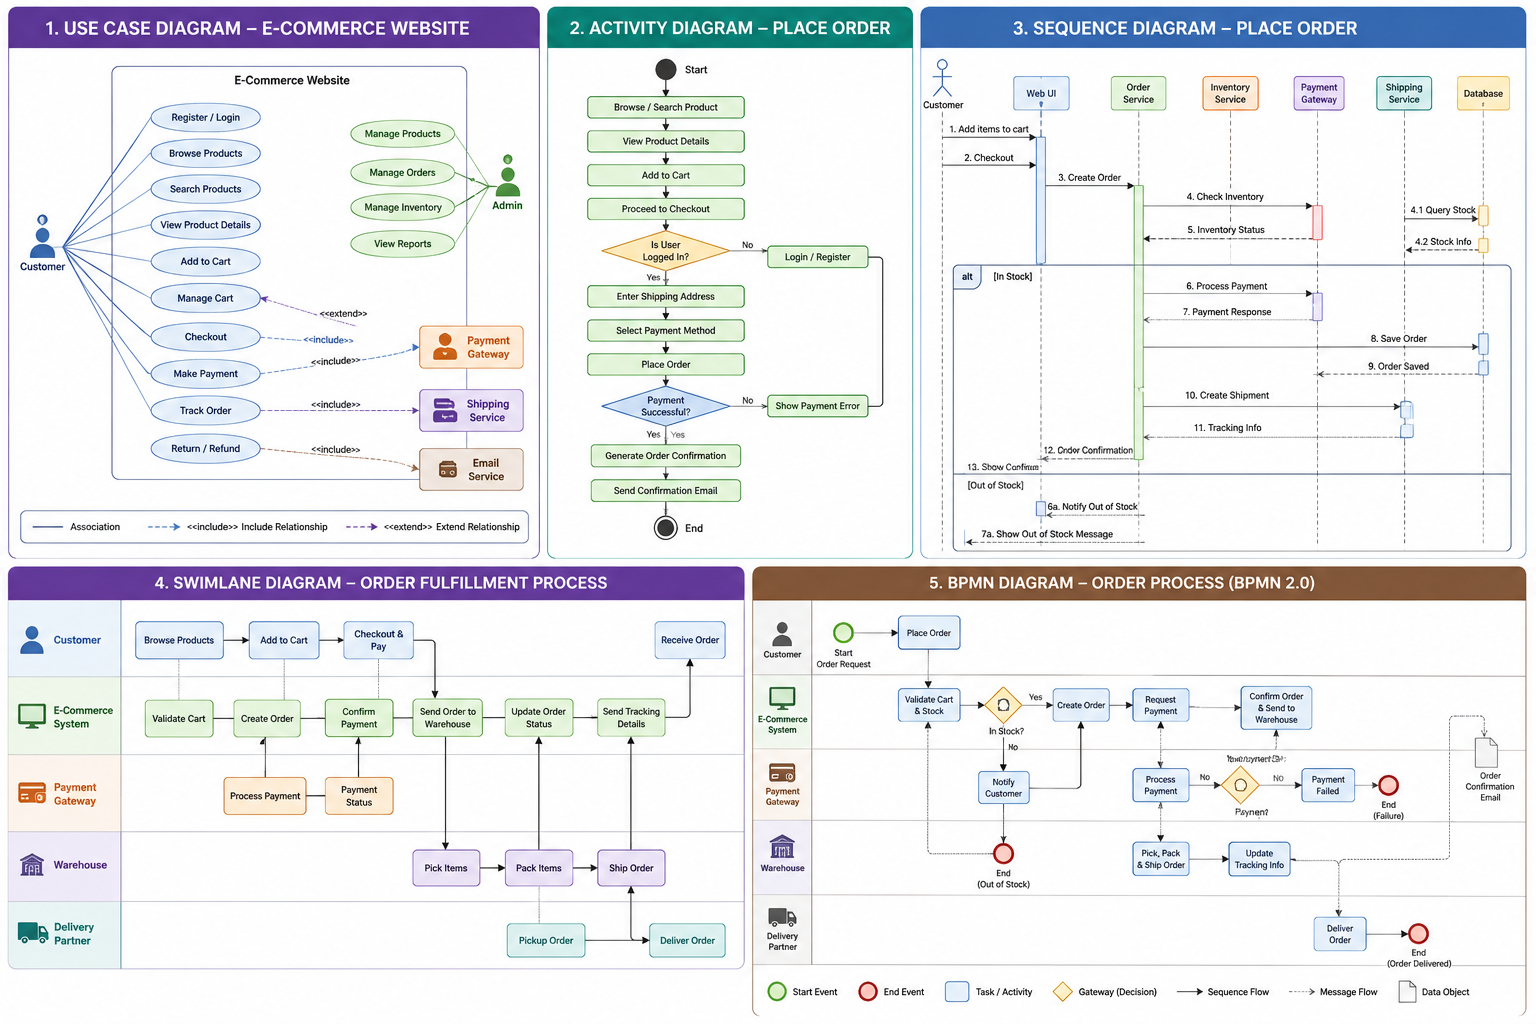
These reference sheets show how a Business Analyst layers multiple diagram styles on a single domain. Use them as a template: pick the diagrams that answer the question you are being asked — scope, workflow, ownership, system interaction, or business process — and combine them only when stakeholders need the full picture.
Diagram Selection Guide
| Need | Best Diagram |
|---|---|
| Show step-by-step process | Process flow |
| Show current vs future process | As-Is / To-Be |
| Show who does what | Swimlane diagram |
| Show formal business process | BPMN 2.0 |
| Show screen layout | Wireframe |
| Show look and feel | Mockup |
| Show clickable interaction | Prototype |
| Show user roles and system functions | Use case diagram |
| Show system boundary | Context diagram |
| Show data movement | Data flow diagram |
| Show status lifecycle | State diagram |
| Show workflow activities and decisions | Activity diagram |
| Show API/system interaction order | Sequence diagram |
| Show data relationships | ERD |
| Show major system integrations | System architecture / integration diagram |
BA Questions to Ask
- What starts the process?
- What ends the process?
- Who performs each step?
- What systems are involved?
- What decisions occur?
- What approvals are required?
- What happens if approved?
- What happens if rejected?
- What happens if information is missing?
- What are the exception scenarios?
- Are there manual steps?
- Are there duplicate steps?
- Where are the delays?
- What notifications are needed?
- What status changes happen?
- What reports are generated?
- What is the purpose of this screen?
- Who will use this screen?
- What fields should appear?
- Which fields are mandatory?
- Which fields are optional?
- What field types are needed?
- Are there dropdown values?
- Are there default values?
- Are fields editable or read-only?
- What buttons are needed?
- What happens when the user clicks Save, Submit, Cancel, or Delete?
- What validations are required?
- What error messages should display?
- Where does the user go after each action?
- What is the start event?
- What are the tasks?
- Which tasks are user tasks versus system tasks?
- What gateways are needed?
- Are gateway paths exclusive, parallel, or inclusive?
- Which roles should be lanes?
- Are there external participants?
- Is message flow needed?
- What events occur during the process?
- What are the possible end states?
Common Mistakes BAs Make
Diagrams should not be created just for documentation. They should validate requirements, clarify process behavior, identify gaps, and support development and testing.
Tools Used
Process flows, swimlanes, formal diagrams
Collaborative diagrams
Free process and technical diagrams
Workshops and brainstorming
Wireframes, prototypes, UI flows
Low-fidelity wireframes
Advanced prototypes
Simple stakeholder-friendly diagrams
BPMN 2.0 process modeling
BPMN process modeling
BPMN modeling and web-based diagrams
UML diagrams as code
Flowcharts, ERDs, state, sequence diagrams
Interview Answer Bank
Top 1% BA Language
Say this, not that.
I make diagrams
I create visual artifacts to clarify process behavior, system scope, data movement, and stakeholder responsibilities.
I create flowcharts
I model happy paths, alternate paths, exception flows, and decision points.
I make wireframes
I validate screen layout, fields, actions, validations, and navigation before development.
I make swimlanes
I clarify ownership, handoffs, and role-based responsibilities.
I know BPMN
I use BPMN 2.0 notation to model formal business processes using events, tasks, gateways, pools, lanes, and message flows.
I help QA
I use diagrams to support test scenario coverage for happy paths, alternate paths, exceptions, status changes, and validations.
I work with developers
I use diagrams to clarify workflow logic, system interactions, data flow, and integration dependencies.
Master Interview Answer
“As a Business Analyst, I use different diagrams for different purposes. Process flows show step-by-step workflows. As-Is and To-Be flows help compare current and future processes. Swimlane diagrams show who performs each step. BPMN 2.0 provides standard notation for formal business process modeling using events, tasks, gateways, sequence flows, message flows, pools, lanes, and artifacts. I use wireframes to validate screen layout, fields, actions, validations, and navigation. Use case diagrams show actors and system capabilities. Context diagrams show system boundaries and external systems. Data flow diagrams show data movement. State diagrams show status transitions. Activity diagrams show workflow logic. Sequence diagrams show system and API interactions over time, and ERDs show data relationships. These diagrams help reduce ambiguity, identify gaps, align stakeholders, support development, improve QA coverage, and validate requirements before build starts.”
Final Memory Table
| Question | Diagram |
|---|---|
| Step-by-step process? | Process flow |
| Current vs future process? | As-Is / To-Be |
| Who does what? | Swimlane diagram |
| Formal business process? | BPMN 2.0 |
| Screen layout? | Wireframe |
| Look and feel? | Mockup |
| Clickable interaction? | Prototype |
| User roles and system functions? | Use case diagram |
| System boundary? | Context diagram |
| Data movement? | Data flow diagram |
| Status lifecycle? | State diagram |
| Workflow activities and decisions? | Activity diagram |
| API/system interaction order? | Sequence diagram |
| Data relationships? | ERD |
| Major system integrations? | System architecture / integration diagram |
Ready to Practice?
Use this guide to revise BA visual modeling concepts, understand when to use each diagram, and explain process flows, wireframes, BPMN, UML diagrams, data flow diagrams, state diagrams, sequence diagrams, ERDs, and system integration diagrams confidently in interviews.
Back to BA Skills Resources